|
|
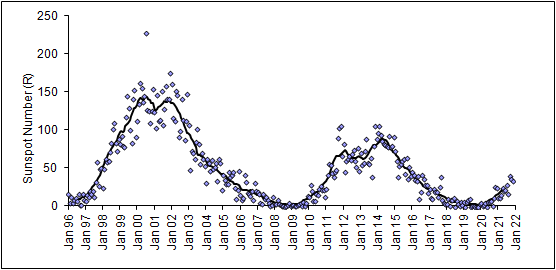
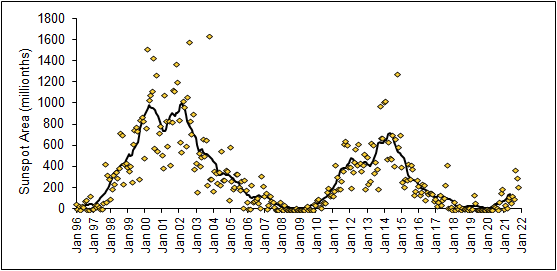
The trends in sunspot measurements can be found by smoothing data over a 12 month period. The two plots below shows the monthly averaged sunspot numbers and sunspot area (the diamonds) together with the smoothed data shown in the form of a curve. It will be interesting to follow the sunspot number and area trends over the next couple of years as the sunspot area is known to peak around two years after the sunspot number.
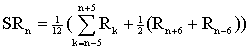
The smoothed sunspot number (and sunspot area) has been derived from the expression given below:-
where:-
Last updated on 04 March 2006. |