|
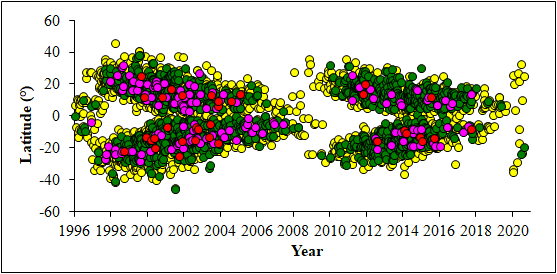
From disk drawings the location of sunspot groups can be measured in terms of heliographic latitude and longitude. For each group seen, its average latitude as it progresses across the solar disk can then be calculated and plotted as a function of time to give the chart below (known as a butterfly diagram). At the start of a new solar cycle, sunspots are usually at high latitudes while at the end they are usually at low latitudes. The maximum measured size of a group is also included in via the four colours: yellow for groups smaller than 100 millionths, green for groups between 100 millionths and 500 millionths, purple for groups between 500 millionths and 1000 millionths and red for groups greater than 1000 millionths.
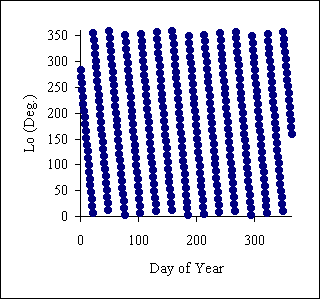
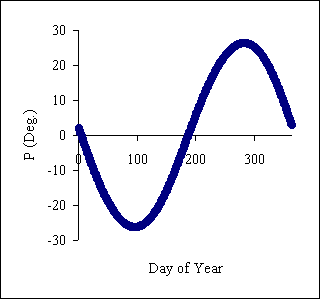
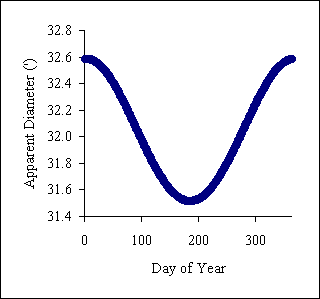
Before the location of a sunspot can be found, the following quantities need to be determined for the date and time of the solar observation:- The graphs below show the yearly variation in these four parameters.
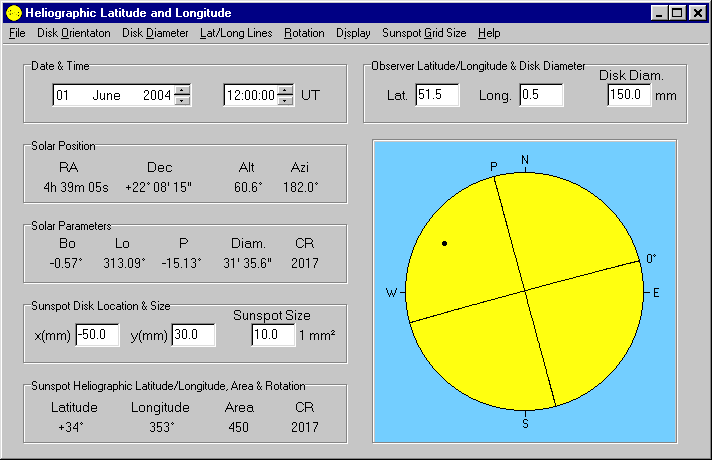
Changes in Bo, P and apparent diameter can be visualised via an animation (you can download this animation directly (322 kB)). Three methods to determine the heliographic latitude and longitude of sunspot groups are described below:- Software Method I have written a three Window 95/98/2000/XP/NT programs to easily calculate sunspot latitude and longitude. The freeware program, Helio v2 is shown below - the only inputs are the date/time and the position of the sunspot (x and y coordinates with respect to the centre of the disk). See the software page for further details for all three programs.
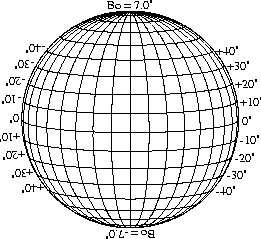
The next two methods require heliographical parameters for each observation. These can be obtained from a variety of astronomical sources including the Handbook of the British Astronomical Association. These sources give regular values for the heliographic coordinates Bo, Lo and P plus the apparent solar diameter and Carrington rotation number. Linear interpolation can be used to calculate the coordinates at times other than 0h UT. A positive Bo indicates that the latitude of the center of the solar disk is in the solar northern hemisphere. Lo decreases with time. A positive P indicates that the axis of rotation is to the east of the north point of the disk. Features on the disk rotate from the eastern limb to the western limbs. Graphical Method Stonyhurst disks are heliographic latitude and longitude grids for a variety of Bo values.
Mathematical Method This method uses the x and y position of a point on the solar disk where the x axis is the east-west line and the y axis is the north-south line. The center of the disk is at (0,0) and x is positive towards the east and y is positive towards the north. The following angles are then calculated:
where
appdiam is the apparent diameter of the Sun (in degrees) and diskdiam
is the diameter of the disk drawing (in the same units and x and y).
The latter two angles,
For
example, if on the 1st January 1999 at 11h 10m, when Bo =
-3.0°, Lo = 139.5°, P = +2.1° and the apparent
solar diameter = 32' 35", a sunspot was measured to be at x = -27mm and
y = -22mm on a 150mm diameter disk drawing, then
Last updated on 30th December 2017. |

