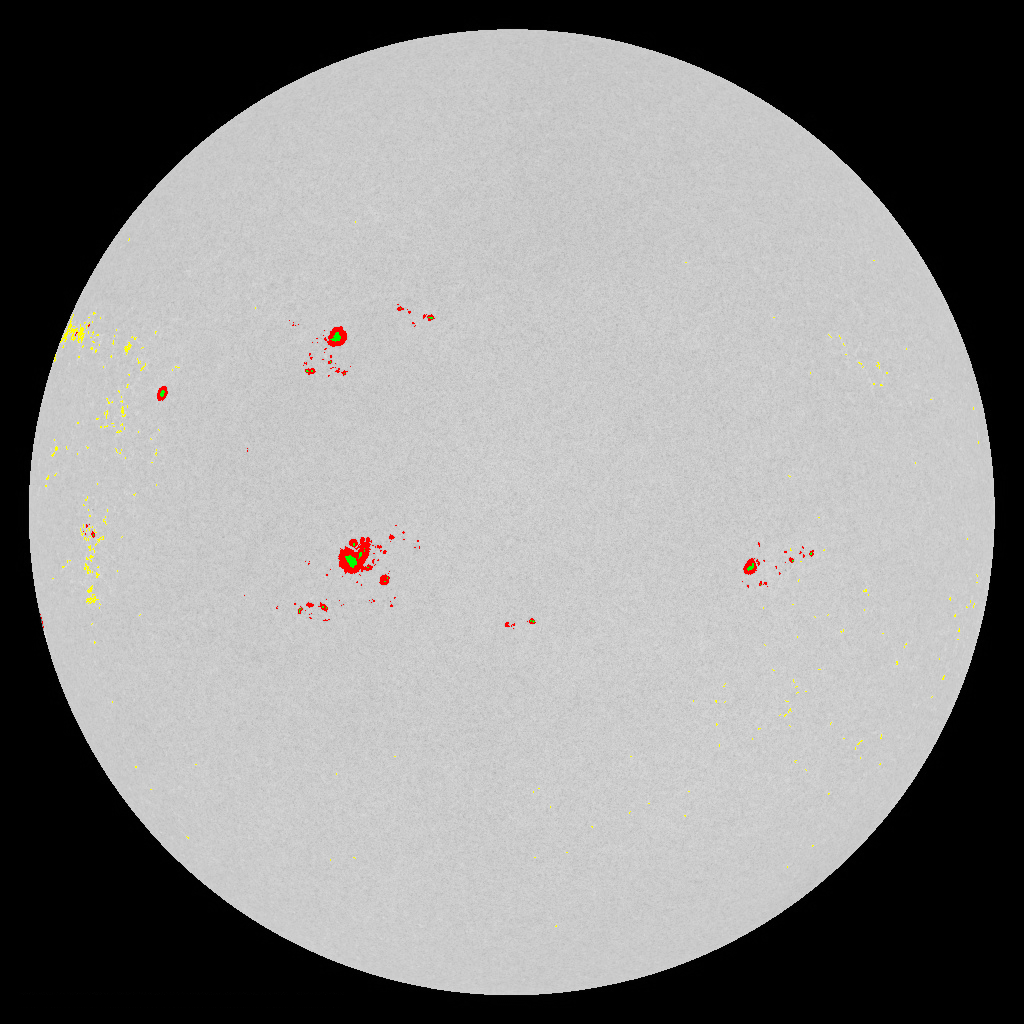
Below are recent SDO HMI Total Sunspot Area (Projected and Corrected) in Millionths of the Sun's Visible Hemisphere (MSH). The plots below show the corrected area for the last 6 months and since 2020. The mask used to calculate the total sunspot area (penumbra and umbra) is shown below (click to enlarge) as well as further information.
The following paper describes the method used to create the sunspot masks and much more: ‘SOHO/MDI and SDO/HMI Sunspot Area Measurement and Analysis’, RAS Techniques and Instruments, Volume 4, 2025, https://doi.org/10.1093/rasti/rzaf024. This paper describes a SOHO and SDO sunspot catalogue which can be downloaded towards the bottom of this page.
The area of individual groups are also available.
| Date | Time (UT) | Proj. Area | Corr. Area |
| 20260328 | 12:00 | 3150 | 2450 |
| 20260329 | 00:00 | 3330 | 2390 |
| 20260329 | 12:00 | 3230 | 2240 |
| 20260330 | 00:00 | 3070 | 2050 |
| 20260330 | 12:00 | 2920 | 1920 |
| 20260331 | 00:00 | 2690 | 1740 |
| 20260331 | 12:00 | 2550 | 1630 |
| 20260401 | 00:00 | 2480 | 1590 |
| 20260401 | 12:00 | 2390 | 1540 |
| 20260402 | 00:00 | 2300 | 1540 |
|
|
|---|---|
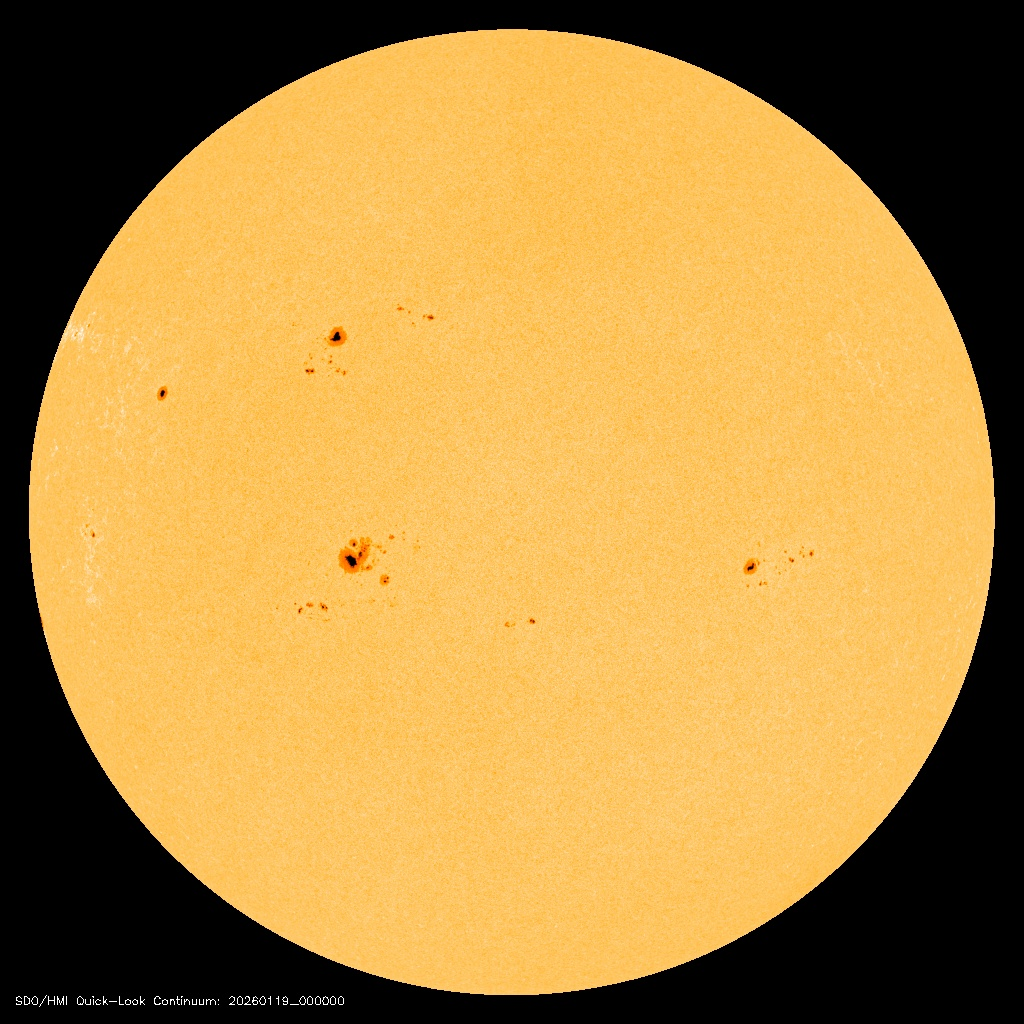
| Latest SDO HMI Image | Latest Mask (red penumbra, green umbra and yellow faculae) |
The projected area is the ratio of sunspots to that of a 2D circle multiplied by 1 million. The corrected area is the ratio of sunspots to that of a 3D hemisphere including a correction for foreshortening multiplied by 1 million. Thus, in the middle of the disk (no forshortening) there is a factor of 2 difference between the projected and corrected areas.
The paper ‘SOHO/MDI and SDO/HMI Sunspot Area Measurement and Analysis’ describes a SOHO and SDO sunspot catalogue. There are two versions: one just giving the date and full-disc areas while the other containing much more detailed information. The structure of both versions is described in this format file (the structure is also included in the catalogue file headers).
The catalogue files are:
The SOHO/MDI continuum images are courtesy of NASA & ESA. The SDO/HMI Continuum images are Courtesy of NASA/SDO and the HMI science team.
Any comments or questions, please email.